With a strong architectural background in visual systems, I led our platform's data visualization strategy and owned the visualization design system, establishing core patterns across the platform. I also spearheaded an AI-enhanced security posture project that combined traditional visualization principles with intelligent insights to transform how teams understand their security landscape.
Crafting cybersecurity AI data visualizations
scroll down to view the project
Disclaimer: Due to confidentiality agreements, the materials involved in these projects are limited. I'm glad to walk-through my process in more detail on a call.
My Role
Primary UX Designer
Team
1 UX Designer (Myself)
Various Project Managers (1 per project below)
Various Devs (1 per project below)

This is an image of a blurred section for designs of an AI-driven security posture
AI Security Posture & Radar Project
Disclaimer: I am happy to show this project in more detail over a call due to confidentiality agreements. This is an internal award-winning competition project which steered product direction.
Most Strategic Award, LogRhythm
Security teams needed more than static metrics - they needed intelligent, contextualized understanding of their security posture with real-time industry comparisons and actionable insights. Traditional visualizations couldn't provide dynamic, AI-driven recommendations based on evolving security data.
Goals of the project
-
Developed an advanced radar visualization system integrated with an in-house LLM, featuring multi-axis security metric visualization with dynamic weighting and real-time industry benchmarking capabilities
-
Created designs for an AI-powered analysis system that provides contextual security insights, grade calculations, and predictive analysis of potential security improvements based on industry standards
-
Implemented interactive exploration features including historical trend overlays and drill-down capabilities, enhanced with natural language explanations of complex security metrics
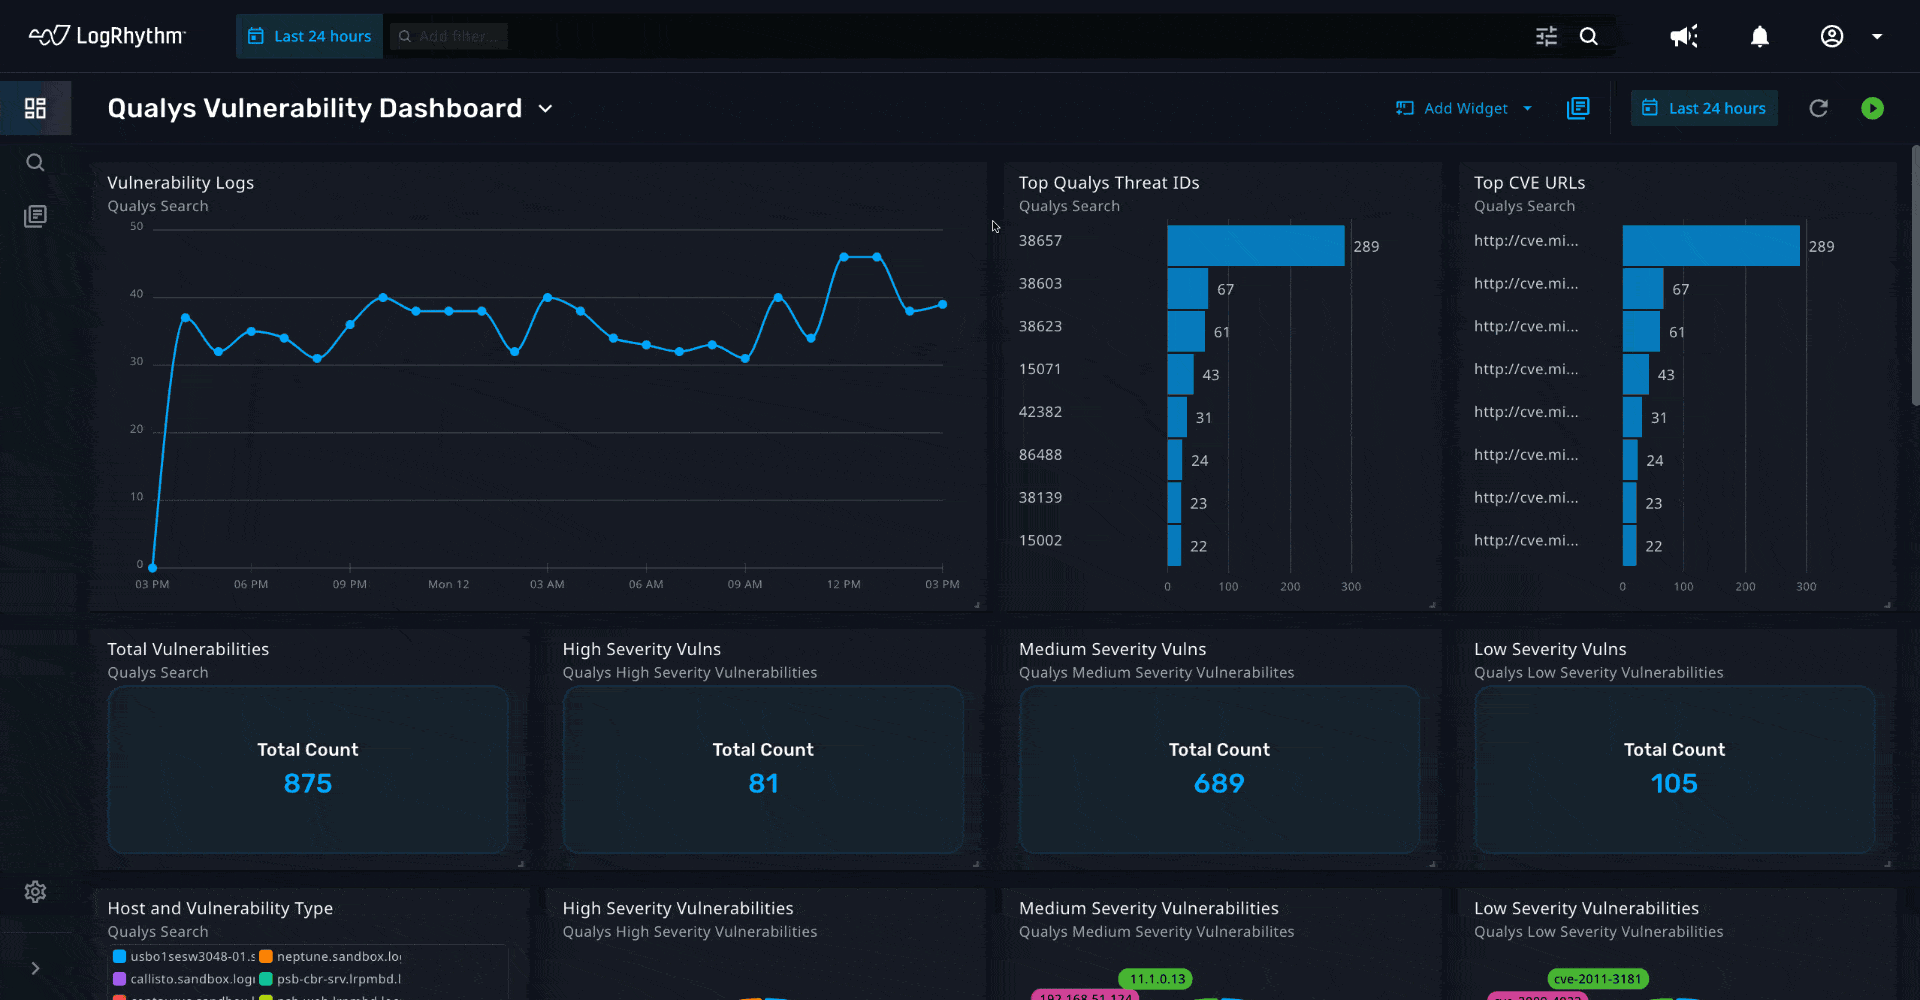
This is a walkthrough of LogRhythm's default dashboard of visualizations
Additional Visualizations I Worked On
Donut Chart & Treemap
-
Redesigned the donut chart visualization with an innovative drill-down system, allowing users to investigate any data slice regardless of size while maintaining visual hierarchy
-
Developed a complementary treemap visualization that maximized space efficiency for hierarchical data, implementing consistent interaction patterns across both visualization types
Multiple Line & Stacked Bar Charts
-
Implemented an intelligent visualization system that coordinated interactions between multiple line charts and stacked bars, enabling seamless analysis of complex data relationships
-
Created an advanced color coding and hover system with synchronized interactions across all chart types, allowing analysts to track relationships between different metrics effortlessly
-
Developed a smart filtering and legend system that maintained visual clarity while handling multiple data series, incorporating clear visual hierarchy for complex data sets
Data Export Stacked Bar Chart
-
Designed an interactive stacked bar visualization for weekly data export analysis, featuring a horizontal scrolling timeline that allowed analysts to navigate through historical export patterns
-
Implemented comprehensive state management including error handling, enabled/disabled states, and configuration modes to provide clear system status and facilitate troubleshooting
-
Created an intuitive interface for monitoring daily export usage trends, incorporating clear visual indicators for different export states and usage thresholds across weekly time periods
Takeaways
Working on these visualization projects reinforced that successful security tools require both technical sophistication and intuitive design.
Each project presented unique challenges - from implementing AI-driven insights in the security posture radar to creating state-aware visualizations for data exports. By focusing on analyst workflows and maintaining close collaboration with stakeholders, we transformed complex security data into clear, actionable insights. The visualization systems we developed didn't just display data - they enhanced how security teams understand and respond to threats, proving that thoughtful design can make even the most sophisticated security operations more accessible and effective.
Areas impacted in platform
Total visualizations made
Want to see more?
I am happy to talk through my research and design work for LogRhythm during a scheduled call, as this work is confidential and cannot be showcased publicly.
Ask me about my process for any of these features:
AI Security Posture Radar Graph
Donut Chart
Treemap
Data Export Bar Graph
Histogram Graph
Trend Graph
Multi-line Graph
Stacked Bar Graph
Competition Dashboard
Visualizations in Panel Architecture